Maps and data
We provide here maps in pdf and png format. The data used to produce those images can be downloaded in the time-series download area.
No items found.
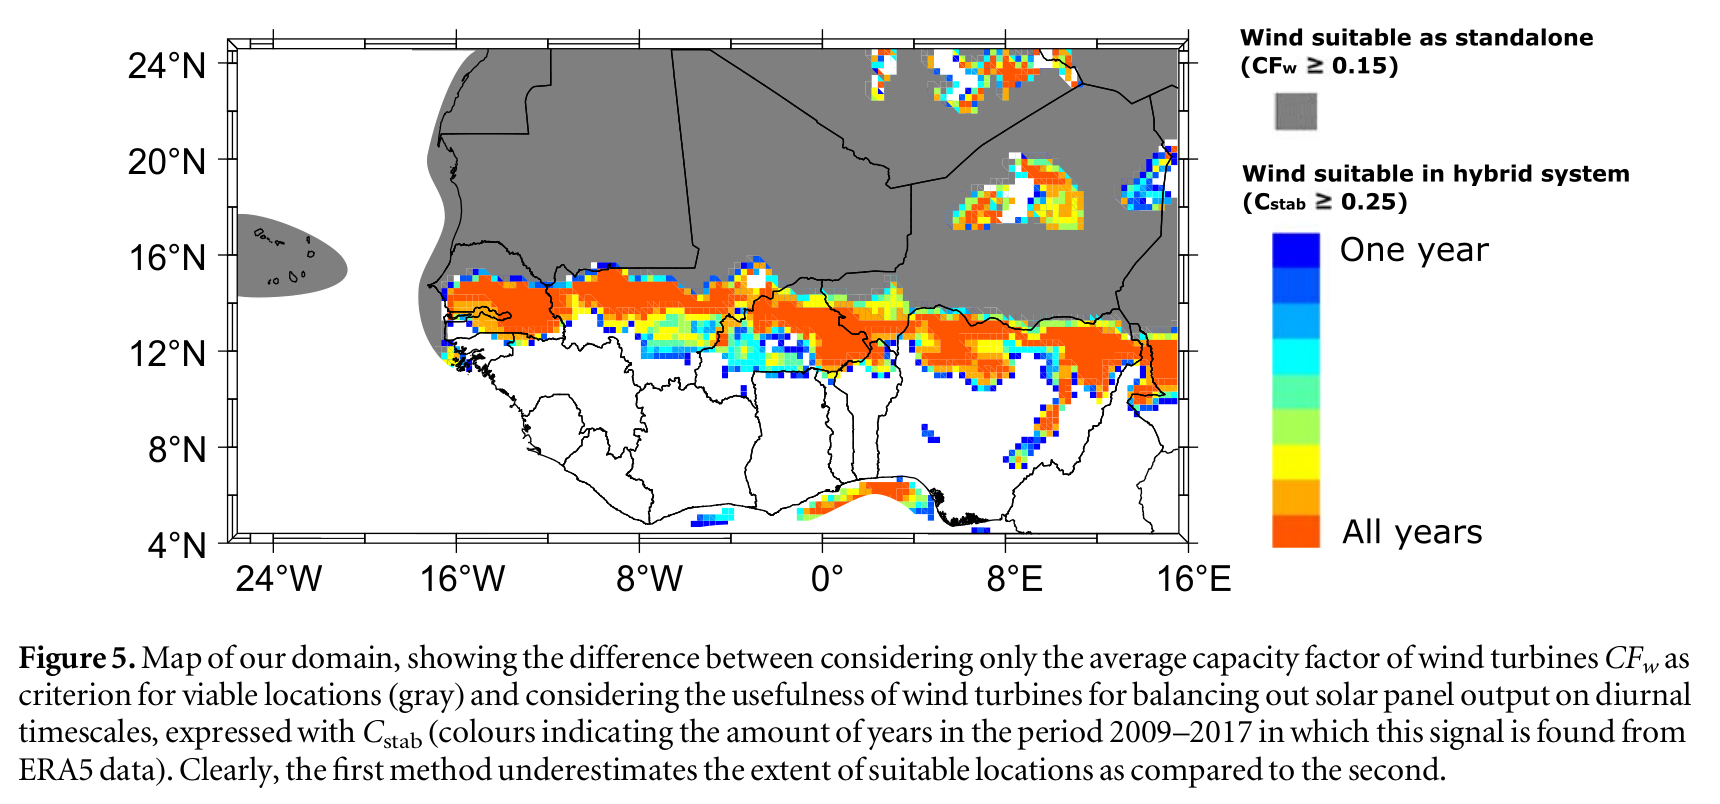
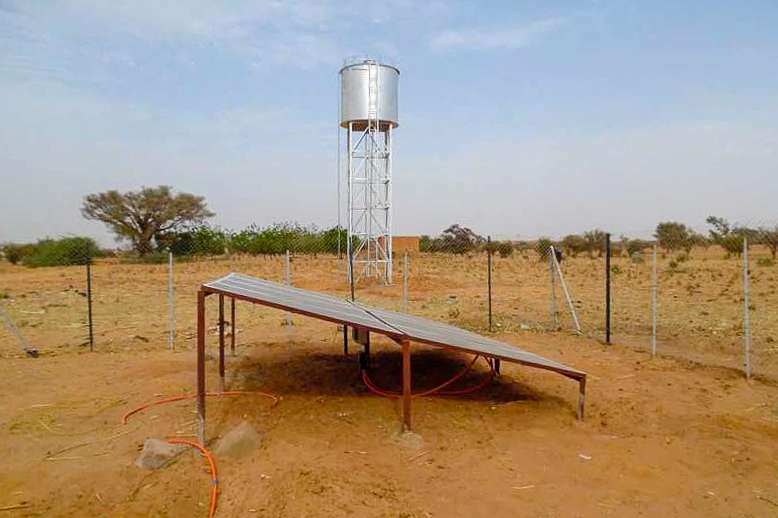
Complementarity of wind and solar power
This map shows the difference between considering only the average capacity factor of wind turbines CF_w as criterion for viable locations (gray) and considering the usefulness of wind turbines for balancing out solar panel output on diurnal timescales, expressed with C_stab (colours indicating the amount of years in the period 2009–2017 in which this signal is found from ERA5 data). Clearly, the first method underestimates the extent of suitable locations as compared to the second (Sterl et al., 2018).

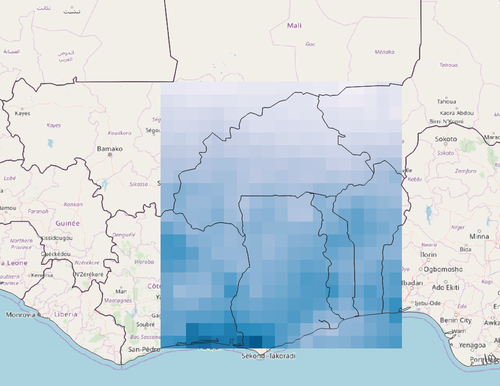
EWEMBI climate data (Volta River basin)
The gridded EWEMBI data set (Lange, 2018) provided here contains following daily time series in the period 1979 to 2016:
- precipitation (pr)
- minimum air temperature (tasmin)
- mean air temperature (tas)
- maximum air temperature (tasmax)
The horizontal resolution is 0.5 degrees and the spatial coverage is the entire Volta River basin (399 grid cells):
- Longitude : -5.75W to 3.25E
- Latitude : 5.25N to 15.25N
Data format: NetCDF